MAPPING
The Alemnis ultra high speed mapping capability is revolutionizing the manner in which surface constituent properties can be characterized by nanoindentation.

A combination of the Enhanced Controller (ECO) with the Ultra High Strain Rate (UHSR) module has enabled mapping to be performed at very high speeds with unparalleled resolution.
High speed mapping is becoming a common technique to map multiphase materials as well as interfaces between materials, or materials with graded properties (e.g., across a weld). The example below shows a fast map across an Aluminium-Inconel interface using a cube-corner diamond indenter. In this case, displacement control has been used in order to keep all indents to approximately the same size regardless of the variation in hardness.
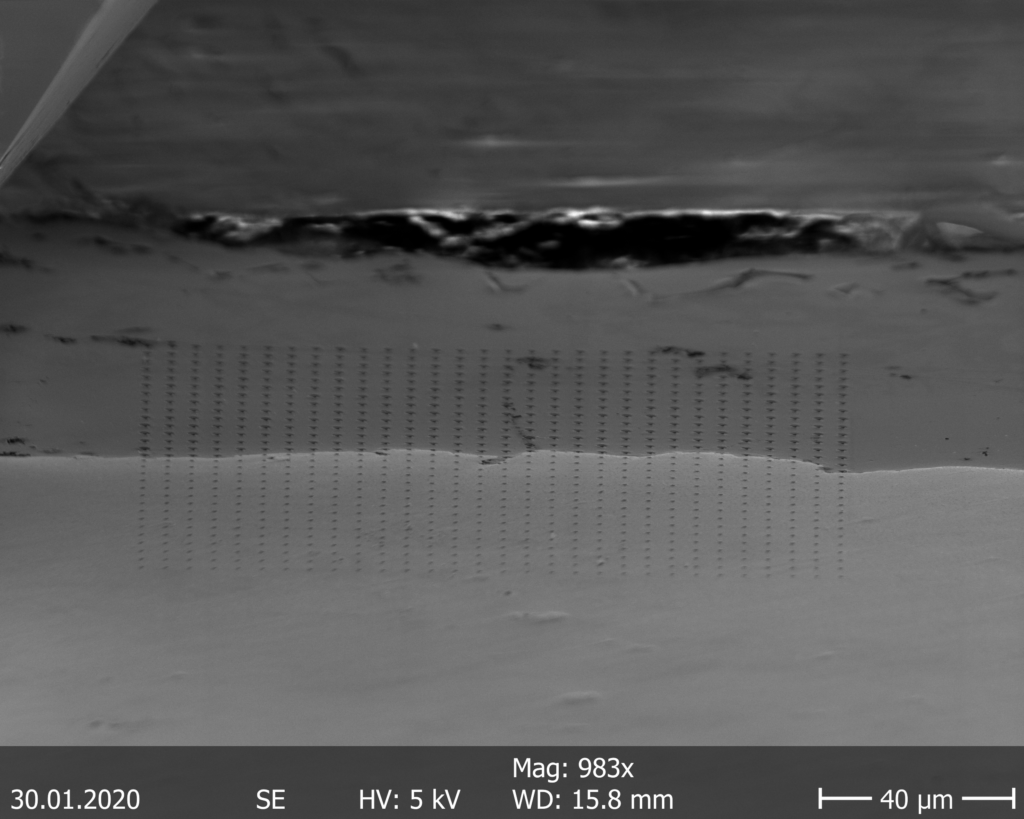
Example of a 5 x 5 indentation map (left) and a 30 x 30 indentation map (right) across an Aluminium-Inconel interface with a cube-corner diamond indenter and displacement control (depth = 150 nm)
The next example shows a more complex alloy, in this case an M3 high speed steel whose microstructure consists of primary carbides (MC and M6C) distributed in a martensitic matrix. Grains of MnS are also present in the Fe matrix, having been included as a means of solid lubrication for better machining. The microstructure was polished down to 0.25 µm alumina finish. The 2D maps for hardness and elastic modulus are shown together with their corresponding histograms, as well as a plot of surface topography which is made from plotting the contact points of all 10,000 indents.
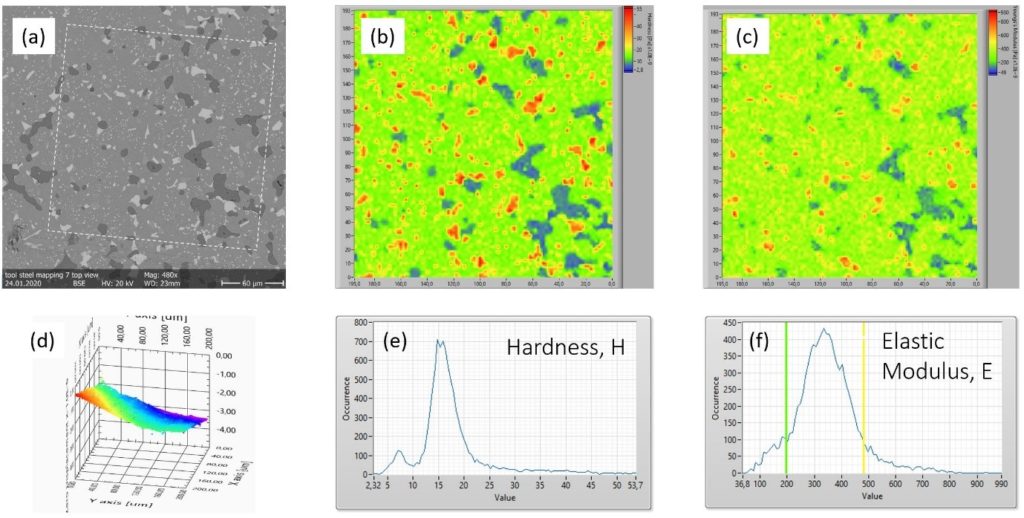
Fast mapping example on a polished M3 high speed steel with 10,000 indents with maximum load 1 mN and 2 µm spacing. SEM image (a), hardness map (b), elastic modulus map (c), surface topography (d), hardness histogram (e) and elastic modulus histogram (f)
To understand the basics of 2D nanoindentation mapping, see the following papers.
Selected References
- N. X. Randall, M. Vandamme and F-J Ulm, Nanoindentation analysis as a two-dimensional tool for mapping the mechanical properties of complex surfaces, J. Mater. Res. , 24 (2009) 679-690. https://doi.org/10.1557/jmr.2009.0149
- O. K. Mahabadi, N. X. Randall, Z. Zong and G, Grasselli, A novel approach for micro-scale characterization and modelling of geomaterials incorporating actual material heterogeneity, Geophysical Research Letters, 39 (2012) L01303. https://doi.org/10.1029/2011GL050411
- L. Sorelli, D. Vallee, A. R. Alizadeh, J. Beaudoin and N. X. Randall, Disclosing the mechanical properties of green Calcium-Silicate-Hydrates by statistical nanoindentation techniques, Advanced Materials Research, 409 (2012) 544-549. https://doi.org/10.4028/www.scientific.net/AMR.409.544