INDENTATION TEST
The first standardised hardness indentation test, developed by Brinell in 1900, used a spherical indenter of hard steel or tungsten carbide, after which a pyramidal indenter was developed in 1925 by Vickers. It was soon found that diamond was the most suitable material to perform an indentation test, its shape being gradually refined over the last 50 years. Microhardness testing, as the logical successor to conventional hardness testing, operates with loads in the range 0.01 – 2 N and the size of the residual indentation can still be measured via optical microscopy, although very small imprints nearing the resolution limit of optical methods cannot be measured accurately. In order to measure hardness using an indentation test with even lower loads, a different method has been developed which does not rely on assessing the size of the imprint, but instead continuously measures the penetration depth and load as an indenter (of known geometry) is pushed into the sample material. With modern ‘depth-sensing’ instruments it is possible to measure displacements of a nanometer scale and so the term nanoindentation has now become widely accepted for this method.
Apart from simply measuring hardness, nanoindentation instruments are also able to measure other material properties such as modulus of elasticity, residual stress, time-dependent creep and relaxation, fracture toughness and fatigue. For very thin films and coatings, nanoindentation has become popular because it allows a wide variety of mechanical properties to be measured without removing the film from its substrate.
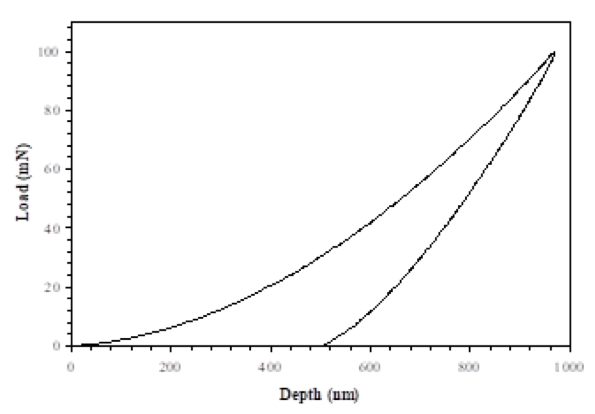
A typical load-displacement curve
A typical load-displacement curve is shown above. After initial contact of the indenter on the surface (contact load less than a few µN or less), the load is increased at a predefined rate to the desired maximum and then decreased, at the same rate, to zero. The unloading curve follows the partial elastic recovery of the sample material, and it is this phenomenon that allows the elastic modulus to be calculated. With a sharp indenter the contact area is initially small, and there is no distinct elastic region at the beginning of the test, i.e., the deformation has both elastic and plastic displacements from the outset.
One of the great disadvantages of nanoindentation is not being able to observe the experiment in real time. This has caused much misinterpretation of indentation mechanisms over the years, simply because people based their theories on the load-depth data, without actually seeing what is happening during the test. Even being able to image a residual imprint after a nanoindentation test (e.g., using Atomic Force Microscopy (AFM)) does not confirm whether a certain cracking event occurred during loading or during unloading.
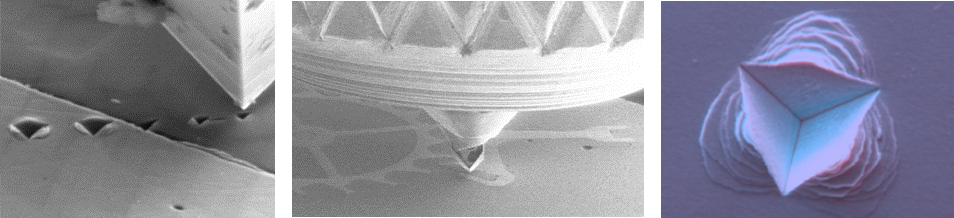
The Alemnis Standard Assembly (ASA) mounted in-situ in a Scanning Electron Microscope (SEM) solves this limitation by allowing a direct observation of the contact zone throughout the nanoindentation cycle.
The advantage of in-situ nanoindentation demonstrated on a metallic glass where serrations on the loading curve could be mistaken for noise, but actually correspond to slip plane deformation as confirmed by in-situ observation in the SEM.
Selected References
- D. Tabor, Proc. R. Soc. A, 192 (1948) 247 (See article)
- M. F. Doerner, D. S. Gardner and W. D. Nix, J. Mater. Res., 1 (1986) 845-851 (See article)
- W. C. Oliver and G. M. Pharr, J. Mater. Res., 7 (1992) 1564-1583 (See article)
- N. X. Randall, R. Christoph, S. Droz, C. Julia-Schmutz, Thin Solid Films, 290-291 (1996) 348-354 (See article)
- Bolshakov, W. C. Oliver and G. M. Pharr, Thin Films: Stresses and Mechanical Properties VI, Materials Research Society, Pittsburgh, 436 (1997) 141-146