Dynamic Mechanical Analysis (DMA)
Dynamic Mechanical Analysis (DMA) is a scientific technique used to characterize the mechanical properties of materials under dynamic and cyclic conditions. It is commonly employed in materials science, polymer science, and engineering to study viscoelastic materials, which exhibit both elastic (spring-like) and viscous (fluid-like) properties. Common testing methods include frequency sweep, amplitude sweep, Continuous Stiffness Measurement (CSM), multicycle, fatigue, impact, strain rate jump test and shock testing.
The Alemnis Standard Assembly (ASA) with its large displacement range of up to 100 µm and the intrinsic true displacement control is ideally suited for such tests. The (ASA) can be used to perform standard DMA analysis upon nanoindentation, compression and tensile testing, offering the widest range of frequency from 0.01 Hz to 10 kHz (7 orders of magnitudes). Moreover, Dynamic Thermal Mechanical Analysis (DTMA) can be performed with the aid of environmental control options, covering the entire temperature range between -150 and 1000 °C. Furthermore, the Relative Humidity Module (RHM) and the Liquid Cell (LIC) allow testing under different gasses, humid air and fully submerged in liquids.
Progressive Multicycle Compression Test
Additively manufactured nanocrystalline nickel (ncNi) microsprings with 10 µm diameter and 20 µm height have been tested in compression upon progressive cyclic displacement. Single cycle (monotonic) displacement can also be applied with the ASA to determine the compliance (or spring constant) of the structure. Such microsprings are designed and produced by a combination of electrodeposition and two-photon lithography. This produces very high-quality metallic structures that do not require any post treatment. Almost any type of structure can be produced, including microsprings, microcoils, microneedles, microlattices, etc. More examples here: https://alemnis.com/additive-manufacturing/ .
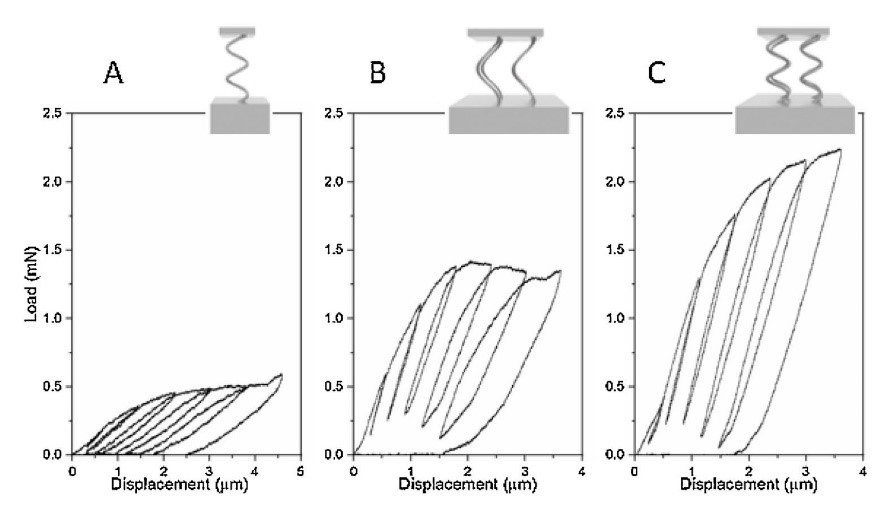

Multicyclic compression test on ncNi microsprings with progressive cyclic displacement up to 4 µm (Courtesy of R. Ramachandramoorthy, Empa)
Progressive Multicycle Tensile Test
The tensile strength of copper structures produced by micro-additive manufacturing (µAM) has been tested upon cyclic fatigue test in true displacement control with 17 cycles of 330 nm. For this test, the ASA has been equipped with a gripper kit for tensile testing (GKT) offering the unique ability to grip and test microscale parts; the jaws of the gripper in the video are less than 20 µm apart. Tensile strength was 342.5 MPa and yield stress 320 MPa; values in line with cold drawn pure copper. Sample has been printed with a Exaddon CERES system.
Multicyclic tensile test on µAM tensile specimen with progressive cyclic displacement. Diameter of gauge section = 5 µm. (Courtesy of Dr Johann Jakob Schwiedrzik, Empa)
Frequency Sweep Test
The combination of intrinsic displacement control and extremely high mechanical stiffness makes the ASA particularly reactive and precise when the indenter velocities changes abruptly. This is important for frequency/amplitude sweep and strain rate jump test investigations.
A typical frequency sweep test consists of maintaining a desired static displacement (or load) over time, while superimposing a set of harmonic oscillation with various oscillation frequencies in the range 0.01 Hz – 10 kHz. Test can be performed during nanoindentation, compression, or tensile testing.
Here, a frequency sweep test was performed during compression of a hydrogel ball of 1 mm in diameter. A constant oscillation amplitude of 10 µm has been maintained while oscillations are progressively increased from 0.1 to 20 Hz every 10 cycles. This test has been performed combining the ASA with a Liquid Cell (LIC), which allowed the sample to be submerged in Milli-Q water during testing to prevent dehydration.
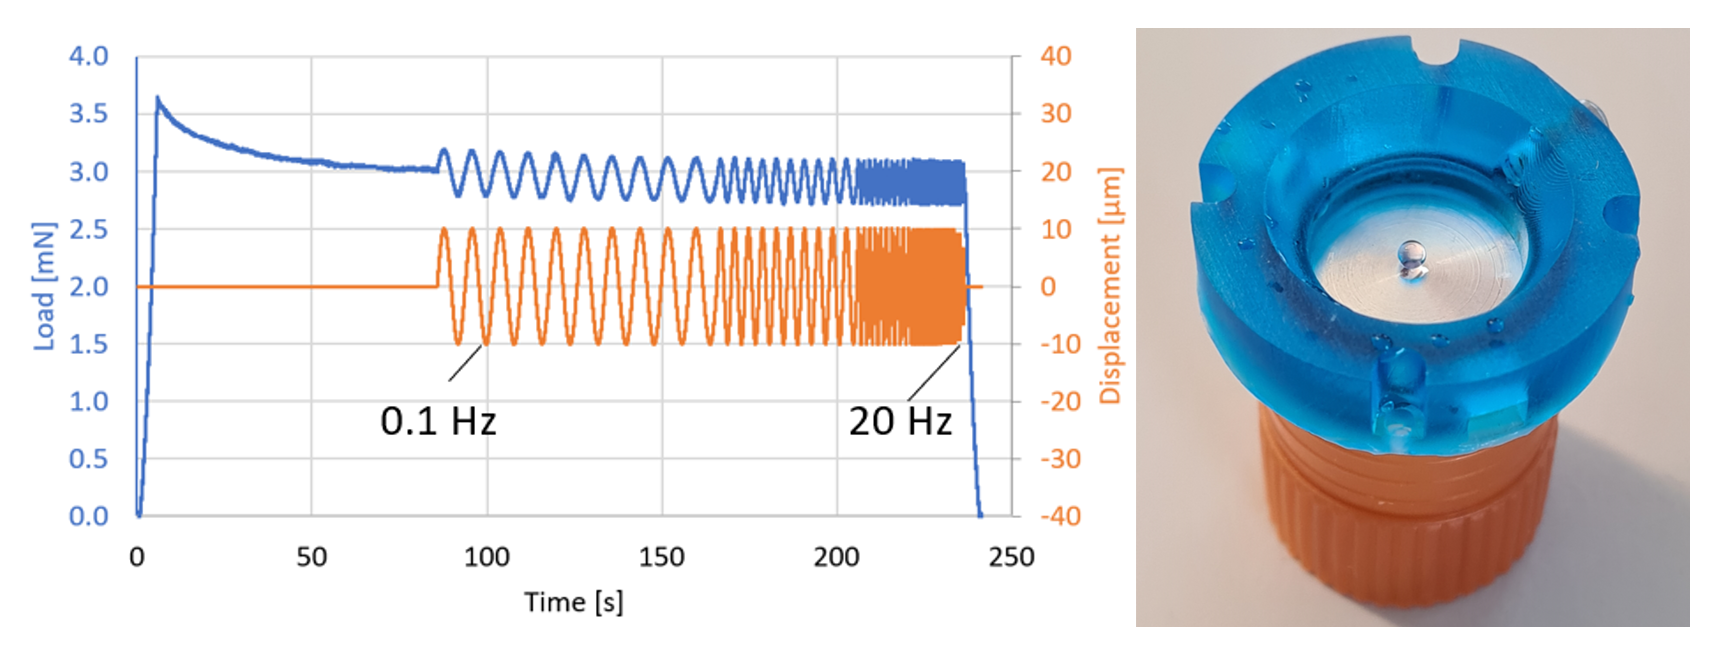
Frequency sweep test during compression of 1 mm hydrogel ball (Courtesy of Dr Chandan Shakya, Wageningen University and Research)
Strain Rate Jump Test
It is well known that the mechanical properties of materials can depend significantly on the strain rate at which testing is carried out. The Strain Rate Sensitivity (SRS) is a measure that reflects such dependencies of mechanical properties on testing speed.
Strain Rate Jump (SRJ) indentation test is a particularly efficient way of extracting the SRS coefficient. In a SRJ indentation test, the strain rate is changed multiple times during the loading segment of a single nanoindentation test. The resulting variations in the load-displacement curve reflect the effect of strain rate sensitivity.
Up until now, SRJ indentation testing has been limited to a narrow range of strain rate from 10-4 to 10-2 s-1. The main limitations are due to the poor capability of conventional testing set-ups to accurately actuate and measure sudden changes in the strain rate. Alemnis pushed the limit of current SRJ indentation technique by orders of magnitude thanks to the combination of piezoelectric actuation/sensing and an inherently stiff machine design.
An example of SRJ indentation test on nanocrystalline Cu (which is very well known to exhibit high SRS coefficient) is shown here where the strain rate is varied from 10-3 to 102 s-1 (5 orders of magnitude) in a single test.
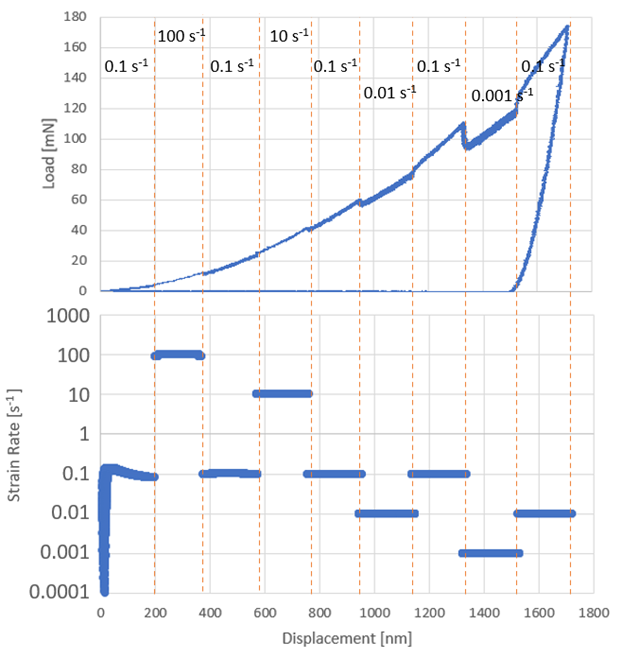
Strain Rate Jump (SRJ) indentation test over 5 orders of magnitude of strain rate, from 10-3 to 10-2 s-1. Target material is ncCu.
Impact Test
High frequency impact testing is a powerful technique to test coating adhesion, toughness and resistance to wear or to simulate forging processes. During such tests, the sample surface is repeatedly hit with a hard tip (typically a spherical tip or a flat punch). The following example shows a test done on tool steel with a 5 µm thick hard coating deposited by PVD. A set of 15 impacts with progressively increasing maximum load from 1 to 1.15 N has been imparted using a spherical diamond tip (60 ° apical angle and 710 nm radius). After 10 cycles, a catastrophic spalling of the superficial layer of the PVD coating is observed.
Impact test on hard PVD coating. Spalling is observed after 10 cycles.
The ASA fitted with the Ultra High Strain Rate (UHS) module is capable of performing impact at a maximum rate of 10 kHz while recording load and displacement at a sampling rate of 1 MHz. To do that, the Alemnis standard load sensor is replace with a dynamic load sensor (or “SmarTip”). The next example shows high frequency impact test on a piece of hardened tool steel, pulse plasma-nitrided to a depth of 120 µm and subsequently coated with Chromium Nitride (CrN) to a total thickness of 4.65 µm.
The sample surface was hit 1’000, 10’000 and 100’000 times at a frequency of 1 kHz. The great advantage of doing impact testing in-situ in the SEM is that, after impact testing, the sample surface can be directly imaged using high resolution SEM to analyse the residual imprints and learn more about the increase in depth as a function of the number of impacts.
In addition, the the UHS module has been combined with the high temperature module (HTM1000) to test this behaviour at various temperature up to 500 °C, which are typical in-service temperatures of the coating under investigation.
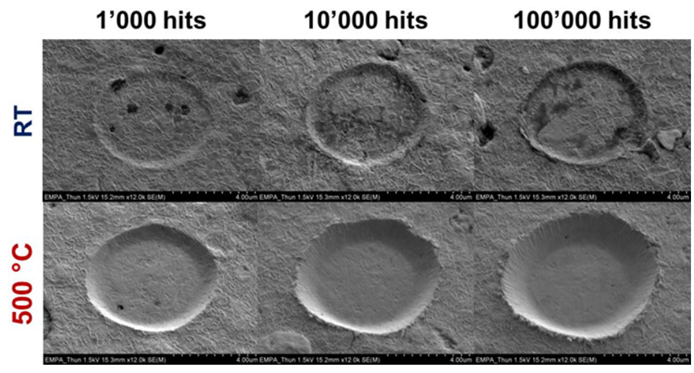
Residual imprints from room temperature and 500°C nano-impact tests (1k and 100k) using a diamond flat punch onto CrN coated nitrided tool steel [https://www.sciencedirect.com/science/article/pii/S0257897217311143]
Shock Test
The flexibility of the Alemnis system allows cyclic testing to be performed in many sample orientations and configurations. Applications include high frequency shock testing, where the ASA has been employed to simulate in-use shock condition on a capacitive accelerometer stopper.
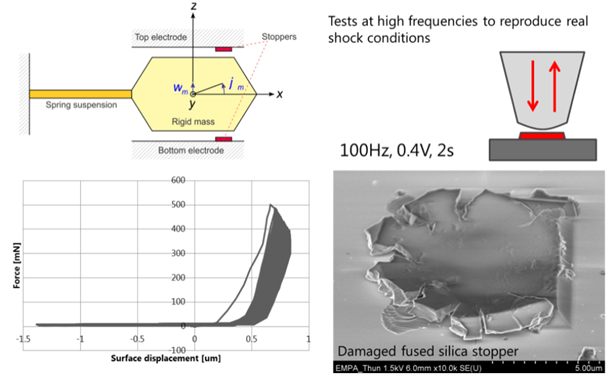
Simulation of a capacitive accelerometer stopper damaged by shock at high frequency.
Continuous Stiffness Measurement (CSM)
Continuous Stiffness Measurement (CSM) indentation is a dynamic mechanical testing method that consists of the superimposition of a harmonic oscillation on the monotonic loading curve of an indentation. The main advantage of the CSM methodology is that the contact stiffness (given as the ratio of the load amplitude to the displacement amplitude for elastic contact), load, and displacement can be measured for each individual unloading segment of each cycle, allowing to extract both elastic modulus and hardness depth profiles.
Fused silica is the most widespread reference material for nanoindentation, due to its very homogeneous microstructure and mechanical properties. In this example, a fused silica plate with a nominal elastic modulus of 72.1 GPa has been indented with 2 different CSM protocols, namely, on the left indentation curve obtained at 10 Hz and 0.6 nm amplitude, on the right, hardness and elastic modulus depth profiles obtained at 300 Hz and 10 nm amplitude. Depth profiles show a very constant elastic modulus at 71.4 GPa in very good agreement with nominal value for this fused silica reference sample (<1% deviation).
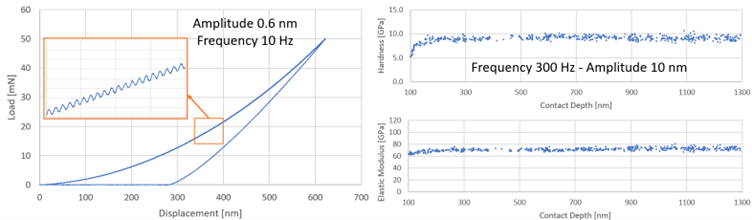
Typical CSM protocols performed on fused silica reference samples.
Depth-dependent elastic modulus and hardness results are particularly important in the study of thin coatings as this allows to discern mechanical properties of the coating from those of the substrate.
in the next example shown below, the CSM method has been applied to a 900 nm thin Al coating deposited on a Si substrate. Depth profiles show that below the very shallow depth of 80 nm, the mechanical properties describe the behaviour of Al. Conversely, by increasing depth, mechanical properties approach the one of Si. Oscillation amplitude of 3 nm and frequency of 1 Hz.
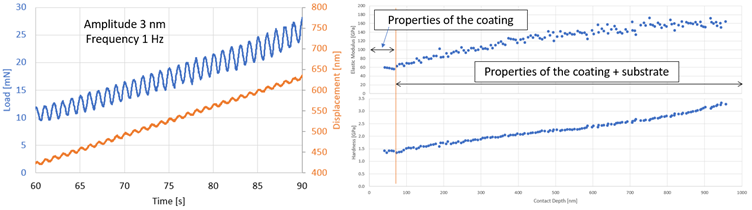
Elastic modulus and hardness depth profiles of an Al coating deposited on Si (courtesy of Dr. Laszlo Petho, Empa)
CSM, when combined with a Strain Rate Jump (SRJ) indentation test, offers a very convenient testing methodology to study the Strain Rate Sensitivity (SRS) of materials. In this type of experiment the strain rate is varied from one segment to another during the same loading stage of a single indentation. When observing the depth profile, like in the example below, it is easy to compare the hardness measured at different strain rates (i.e., different depths) and to extract the SRS. Importantly, the measured elastic modulus is independent on the imposed strain rate, as it is expected to be for a metal. The tested material is nanocrystalline Cu and results are in very good agreement with a recent publication on analogous sample [https://doi.org/10.1016/j.apmt.2022.101415]
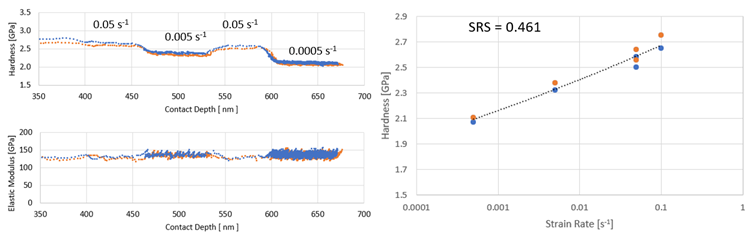
Strain Rate Jump (SRJ) indentation test performed on ncCu. (Courtesy of Dr Johann Jakob Schwiedrzik, Empa)
Stress-strain Curves from Spherical Nanoindentation
Another important application of CSM, when applied to spherical indentation, is the extraction of bulk equivalent and tensile like stress-strain curves. The peculiarity of spherical indentation is that the strain is increasing with increasing indentation depth (unlike Berkovich indentation where the strain is constant with depth). It is therefore possible to convert depth profiles into stress-strain curves. The Alemnis software allows to post process the obtained stress-stress curves in order to extract yield stress, yield strain and work hardening parameter in an automated manner, being a unique resource to apply the methodology to large automated mapping.
An example is shown here where the nanoindentation stress-strain mapping tool has been used to solve an applied engineering problem from the nuclear field [https://doi.org/10.1016/j.fusengdes.2023.113977]. The picture below shows the SEM image of a cross-sectioned diagnostic window from the ITER (International Thermonuclear Experimental Reactor). The cross-section exposes the three materials (Inconel 625, commercially pure aluminium and fused silica) that compose a diffusion bonded joint used to connect the window to the first containment structure. A set of maps with more than 1300 nanoindentations each has been recorded on across the diffusion bonded joints. A correlated set of SEM image, hardness map, elastic modulus map and yield stress map is shown below.
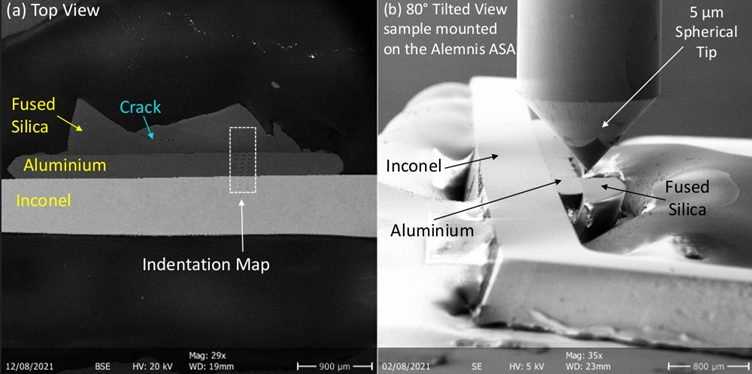
SEM image of the cross section of a diagnostic window from the ITER field [https://doi.org/10.1016/j.fusengdes.2023.113977]
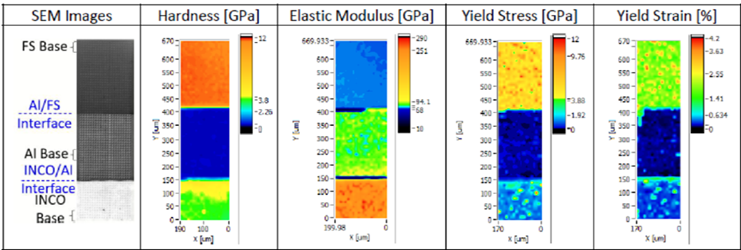
Comparison between SEM image, hardenss map, elastic modulus map and yield stress map obtained from a spherical nanoindentation map [https://doi.org/10.1016/j.fusengdes.2023.113977]